- 1. Introduction
- Task automation for virtual screening of a diabetes database.
- Ease the use of "in silico" tools to users not familiar with these techniques.
- Reduce time and money expenses related to "in vitro" experimentation.
- Query in DIA-DB to get information about the approved or experimental drugs containd in the chemical database.
- Inverse virtual screening, by performing large-scale inverse docking in a set of proteins involved in diabetes, aiming to identify potential target of a query compound.
- 3D shape similarity of antidiabetic bioactive compounds accesible in the DIA-DB chemical database.
DIA-DB is a web-based open tool for performing chemoinformatics to a chemical and protein database related to diabetes mellitus. This tool serves to three main objectives:
DIA-DB technically allows three types of database searching:
- 2. DIA-DB tool services
a. Consulting DIA-DB drug database
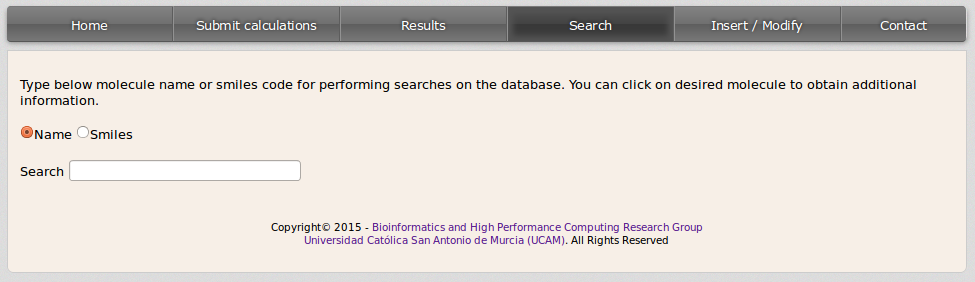
Performing a search in the database is an easy task the user can do from the search window in the site. The user can perform the search to get information about the approved or experimental drugs containd in the chemical database by two means:
- Compound name: click on Name for performing a query by the common or the chemical systematic name of a compound.
- Smiles code: click on Smiles and start inserting the smiles code of the query compound.
A list with the matching compounds will be displayed:
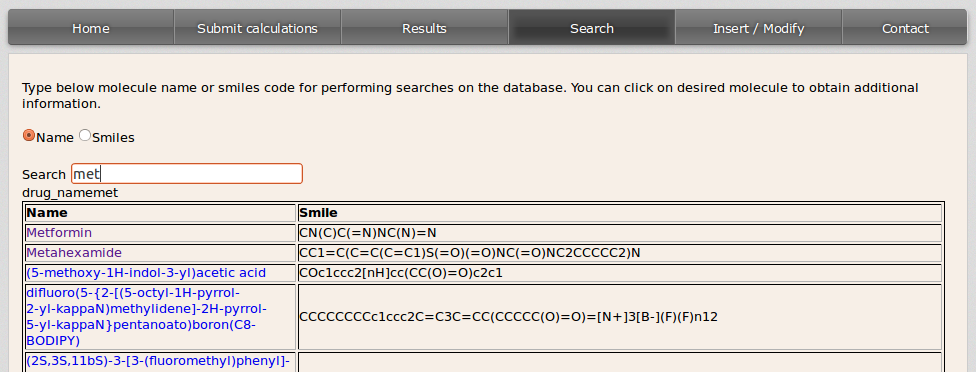
If the user wants to get all the drugs in the database it can be done by filling the blank space with % either from the Name or the Smiles option.
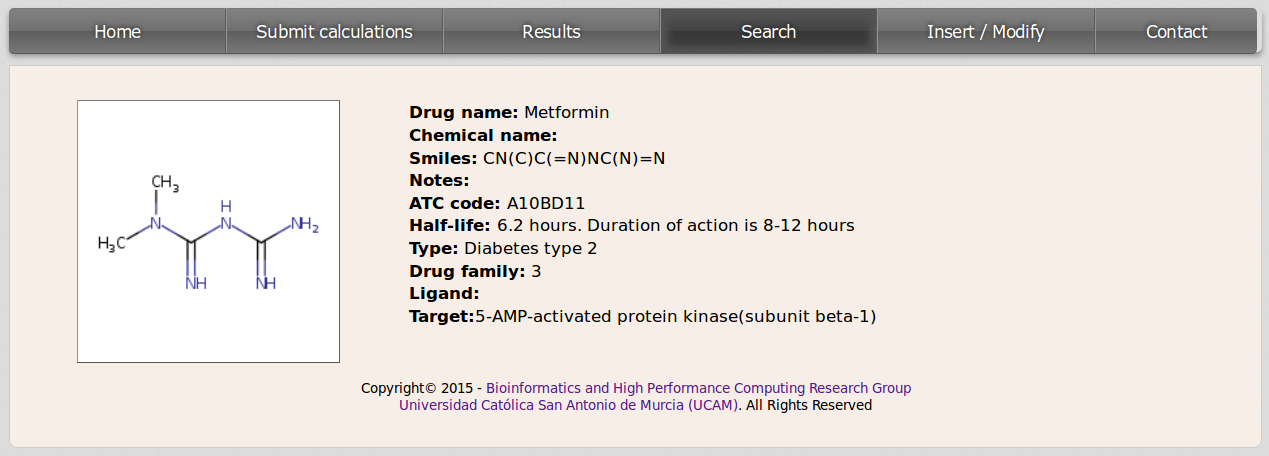
For checking the information contained in the database for any compound the user should click on the drug name. Then a new page will be loaded displaying data about the molecule.
b. Performing inverse virtual screening
Performing a search in the database is an easy task the user can do from the search window in the site. The user can perform the search to get information about the approved or experimental drugs containd in the chemical database by two means:
This action can be done from the Submit calculations site and checking Docking option. Then insert the smiles code of the query molecule in the LIGAND(SMILES) blank field. If the user does not know the smiles code, it can be obtained by drawing the molecule with the JME applet that will be displayed after clicking on Draw Molecule botton. Once the molecule has been drawn just click Submit Molecule and the smiles code for the user compound will be inserted in the LIGAND(SMILES) field. DIA-DB server will automatically generate the 3D coordinates information by means of Open Babel (www.http://openbabel.org).
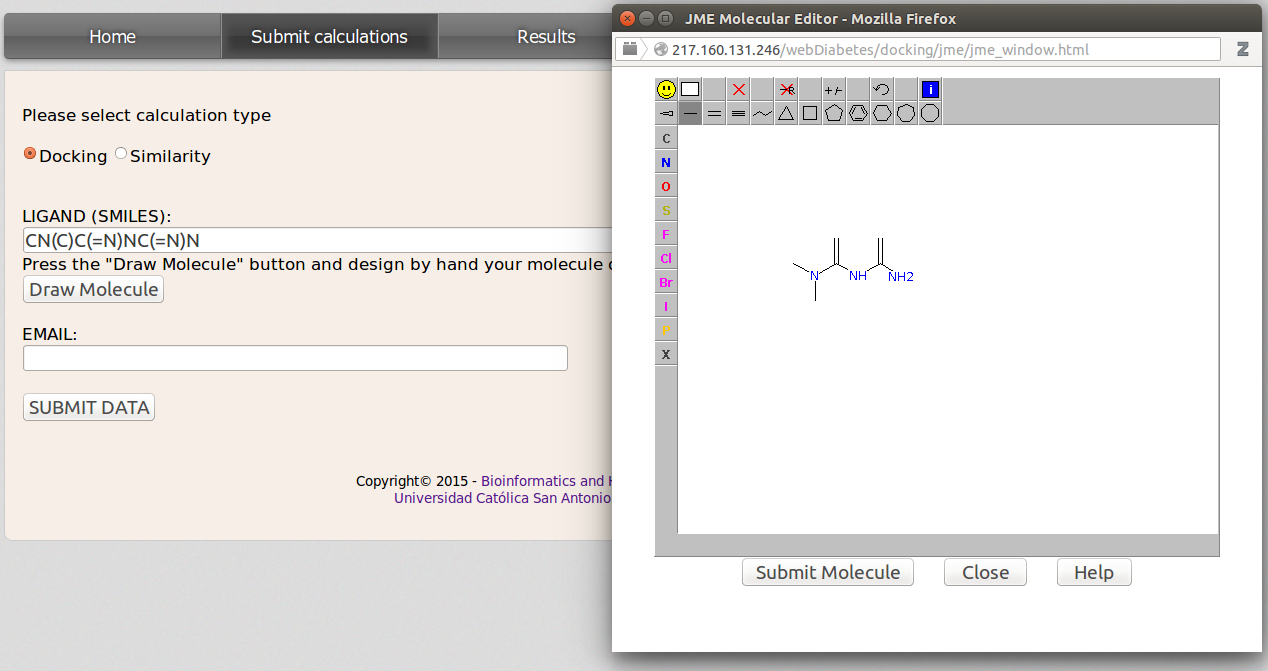
Now insert a valid email address and click SUBMIT DATA. Once the calculations are finished the user will be noticed by email with a link to the results.
c. 3D shape similarity
Go to the Submit calculations site and check Similarity option. Now follow the same steps as for performing inverse virtual screening.
The "in silico" methods implemented are DIA-DB is suitable only for small molecules like drugs. Please avoid to upload as the query macromolecules like proteins, nucleic acids, poly-peptides or other bio-inorganic compounds containing atoms other than C, H, O, N, P, S, and halogens. Jobs involving those molecules will have no results.
- 3. Results visualization and download
After simulations are completed, DIA-DB server will send an email to the user with a link that will open a site where the results will be displayed, this can take from several hours to two or three days depending on the query compound and cluster occupation. Inverse docking results will be displayed, in a table, in descending order by the value of the binding affinity from the docking simulation.
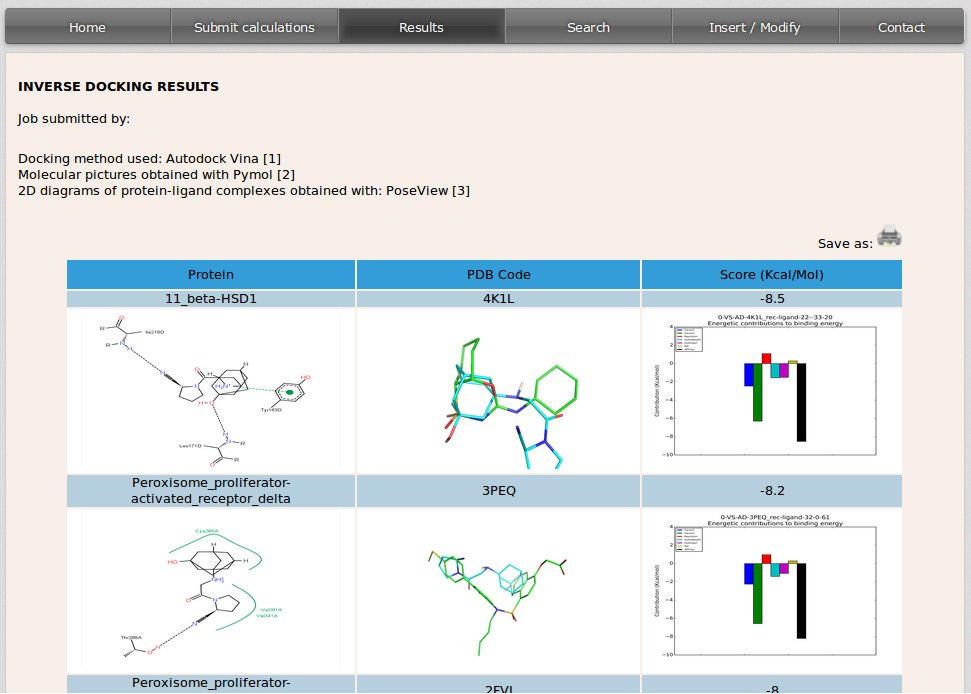
The columns in the table show from left to right:
- 2D diagram showing the interactions that take place between the protein and the molecule in the conformation with the best binding affinity predicted in the docking simulation. This image is built with PoseView (http://poseview.zbh.uni-hamburg.de).
- 3D image of the query molecule (in blue) overlaped to the compound that was co-crystalized with the protein target in the PDB model (in green). The code on top of the image corresponds to the PDB (http://www.rcsb.org) code of the protein target.
- Binding affinity value in Kcal/mol obtained after the simulation for the query compound and protein target complex. The bindig affynity is broken down into its energy components and they are displayed in a graphical representation.
Each raw in the table corresponds to the result of the simulation of the docking between the molecule introduced by the user and every protein target in the database.
3D shape similarity results are also displayed in a table. In the left side of the table it is specified the PDB code of the cristal containing the ligand that is similar to the user input molecule followed by the PDB code for that ligand. On the right side it appears the score value [range 0-1] for the similarity of both ligands. The image displayed shows the overlapping of the molecule used as input by the user (in blue) and the similar drug of the database (in green).
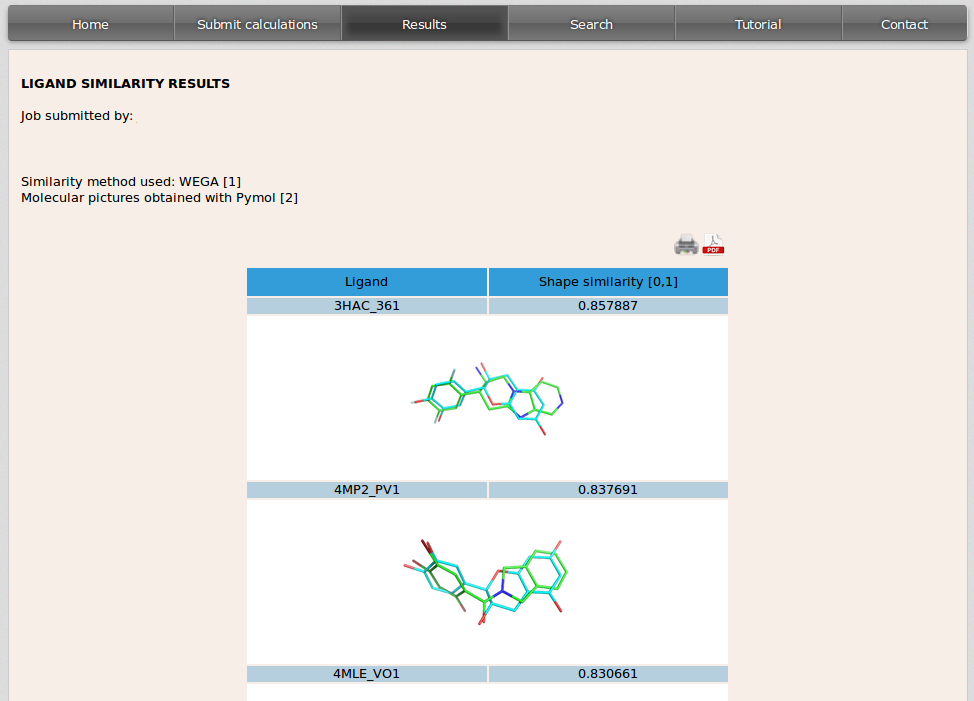
Images can be shown at a higher resolution by clicking on them.
Results can be downloaded in a pdf document. This is an easy task that can be performed by clicking on pdf link at the top rigth of the table of results.